


When you have one metric derived from another, sometimes you need to see another metric alongs session or average me in session. Doing so allows for a quick comparison.
That comparison is why Google introduced a beta feature in its Google Analytics solution called Calculated Metrics. Calculated metrics are metrics derived from the existing preset of metrics in Google Analytics.
Calculated metrics are displayed alongside the standard metrics in the custom report graph.
There are two advantages Calculated Metrics offer to analysis.
First, and most straightforward calculated metrics saving users a step in calculating a compound metric that are routinely discussed in business intelligence discussions.
Second calculated metrics permits a metric comparison in a custom report or dashboard, allowing users to better view performance on a calculated metrics that is important to themselves or the business.
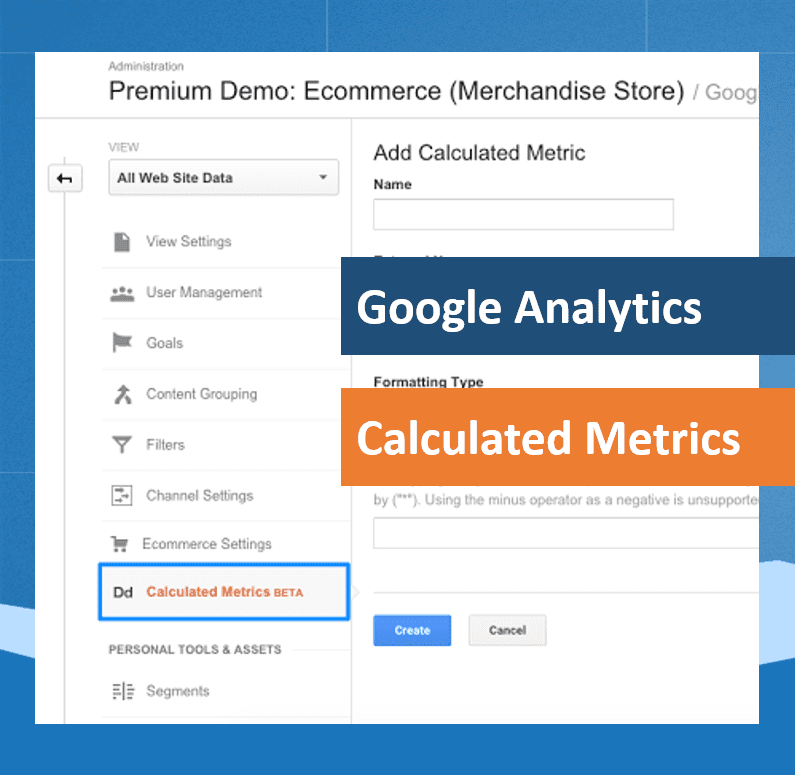
To use calculated metrics, access the admin panel and navigate to the View column of a given analytics profile. Select Calculate Metrics.
The selection presents a few selectors and text boxes to enter the calculated metric. Theres a text box for a label for the metric, with a unique label available for API calls below it. The textbox for the API call is filled out automatically as the label is typed.
Five mathematical formats are available, all familiar to those with deal with mathematics and programming regularly. Selecting one of the formats determines the format of the calculated metric.
- Float
- Integer
- Currency
- Time
- Percent
After selecting a format, the user types the calculated metric formula in a text box. A created formula relies on simple math operators addition, subtraction, multiplication, and division. Google Analytic metrics are highlighted within double braces, similar to what is seen in a programming language.
A calculated metric is structure like a script, shown in the following image:
Users can add up to 5 calculated metrics at the view level in the standard version of Google Analytics. Google Analytics premium offers more, supporting up to 50 metrics.
To get the most benefit from calculated metrics, consider the following tips:
1. Decide who will view the account where the calculated metric is placed. Add a calculated metric that would be of most interest to the users of the given Google Analytics view. The metrics appear in the custom reports and dashboards, so its best to plan a report with the metric accordingly .
2. Pick calculated metrics which augment the metrics in the reports.Lunametrics provides a few great examples on their page. A favorite is the return metric analyzing and tracking returns against sales metric which appears in the report. The trick to a good metric is to select one which has to calculated regularly, then see if the metrics in the reports can serve as a basis for the calculated metrics.
3. Label metrics with a description meaningful to the business or organization that manage the reports, rather than a generic label. This will help other managers who follow the reports to use the analysis as well as assist teams who may follow after you move on. You can also add a mention of when the metrics was added in the annotation panel.


Post Your Comment
Comments